Reactor shutdown xe chart
Autor:
Д.Ильин: vectorization
Shortlink:
Zdroj:
Formát:
794 x 574 Pixel (1618 Bytes)
Popis:
Iodine Pit
Graph showing the concentration of Xenon and the reactivity of the nuclear reaction from the moment the reactor is shutdown.
Graph showing the concentration of Xenon and the reactivity of the nuclear reaction from the moment the reactor is shutdown.
Licence:
Credit:
Vlastní dílo
Relevantní obrázky

(c) RIA Novosti archive, image #155684 / Anton Denisov / CC-BY-SA 3.0

(c) RIA Novosti archive, image #155689 / Anton Denisov / CC-BY-SA 3.0


(c) RIA Novosti archive, image #450317 / A. Khrupov / CC-BY-SA 3.0


(c) RIA Novosti archive, image #132602 / Ruslan Krivobok / CC-BY-SA 3.0


















Relevantní články
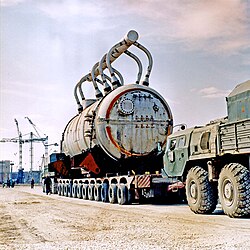
VVER-1000Vodo-vodní energetický reaktor VVER-1000 je jaderný reaktor řady VVER s jmenovitým elektrickým výkonem kolem 1000 MW a tepelným výkonem 3000 MW. Tento typ reaktoru je od října 2018 nejrozšířenějším tlakovodním reaktorem. Z 60 celosvětově provozovaných reaktorů VVER je 37 reaktorů právě typu VVER-1000, což je 7,5 % z celkového počtu energetických reaktorů na světě. .. pokračovat ve čtení
